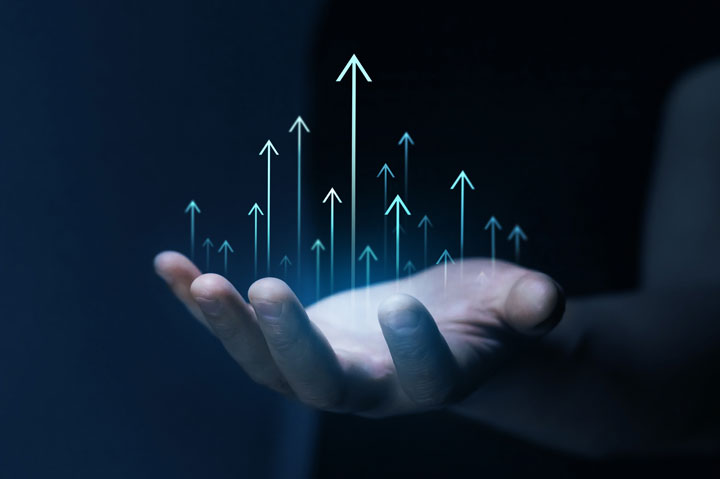
It may be difficult to recall in the haze of the last three years, but the arrow was pointing straight up for the promo industry in the early months of 2020. It was going to be a record year with seemingly limitless possibilities.
Obviously things took a bit of a detour. But here’s the good news: the industry is back. Sure, you can judge by the fact that 2022 promo revenue matched 2019’s figure of $25.8 billion. But it’s also reflected in countless other ways in this year’s State of the Industry report, from the accounts of distributors and suppliers to the data contained within. Pick a metric: average order values, distributor margins, client retention, orders delivered without errors. They all show the same pattern: a bottoming out in 2020, a rebound in 2021, and a full recovery to pre-pandemic levels in 2022.
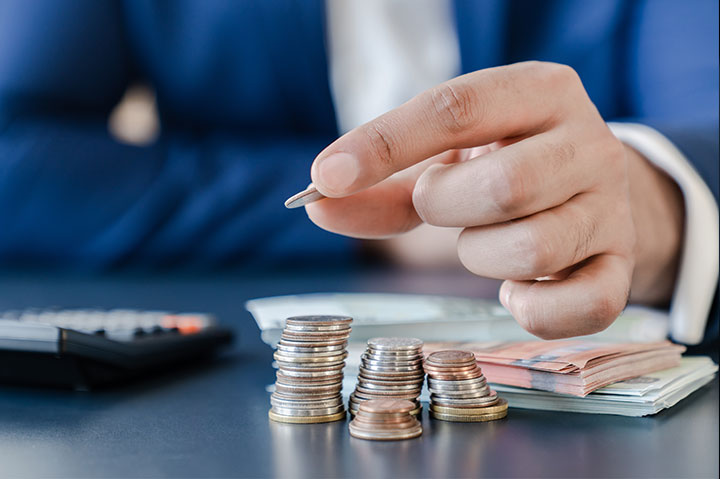
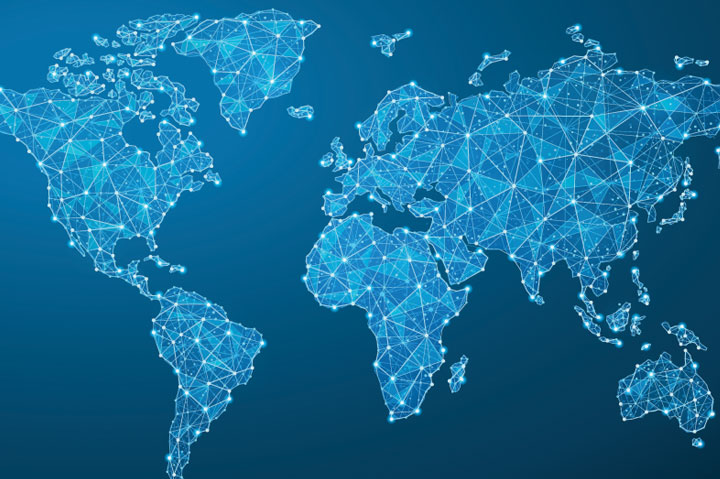
It’s a feat worthy of celebration. Yet the hard work is far from over. Distributors and suppliers alike are still sorting through price pressures, labor challenges, sourcing diversification and digital technology adoption.
Our annual State of the Industry coverage will help you face it all. The following report contains a plethora of exclusive statistics and strategies to help inform you and improve your business. Distributor-supplier relationships, price increases, supply chain metrics, international sourcing trends – it’s all covered here to guide your next moves. The promo industry is back. Now, it’s time to make it even better. – C.J. Mittica